📖 Deep Dive
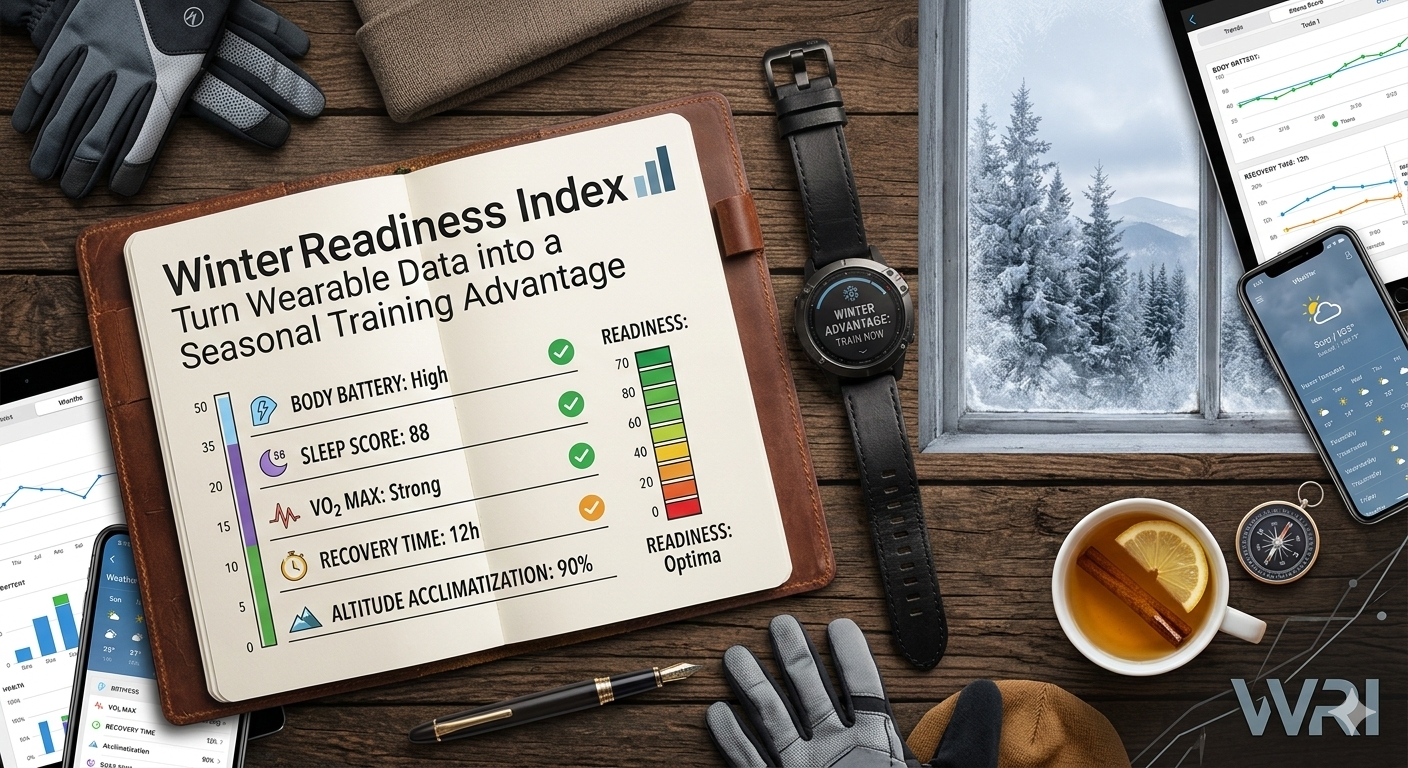
Winter Readiness Index: Using Your Wearable to Beat Seasonal Fatigue
Winter usually means lower daylight, more indoor time, and disrupted routines. Your wearable is quietly tracking how your body responds – but most people glance at a readiness score, shrug, and train the same way anyway.
This guide turns your winter data (HRV, resting HR, readiness, sleep, VO₂ max estimates) into a simple system: when to push, when to maintain, and when to back off so you avoid the “February burnout” while still making gains.
The 5 Core Metrics That Matter Most in Winter
| Metric | What It Reflects | Winter-Specific Insight |
|---|---|---|
| Resting Heart Rate (RHR) | Baseline cardiac workload & recovery | Early signal of illness, overreaching, or poor sleep |
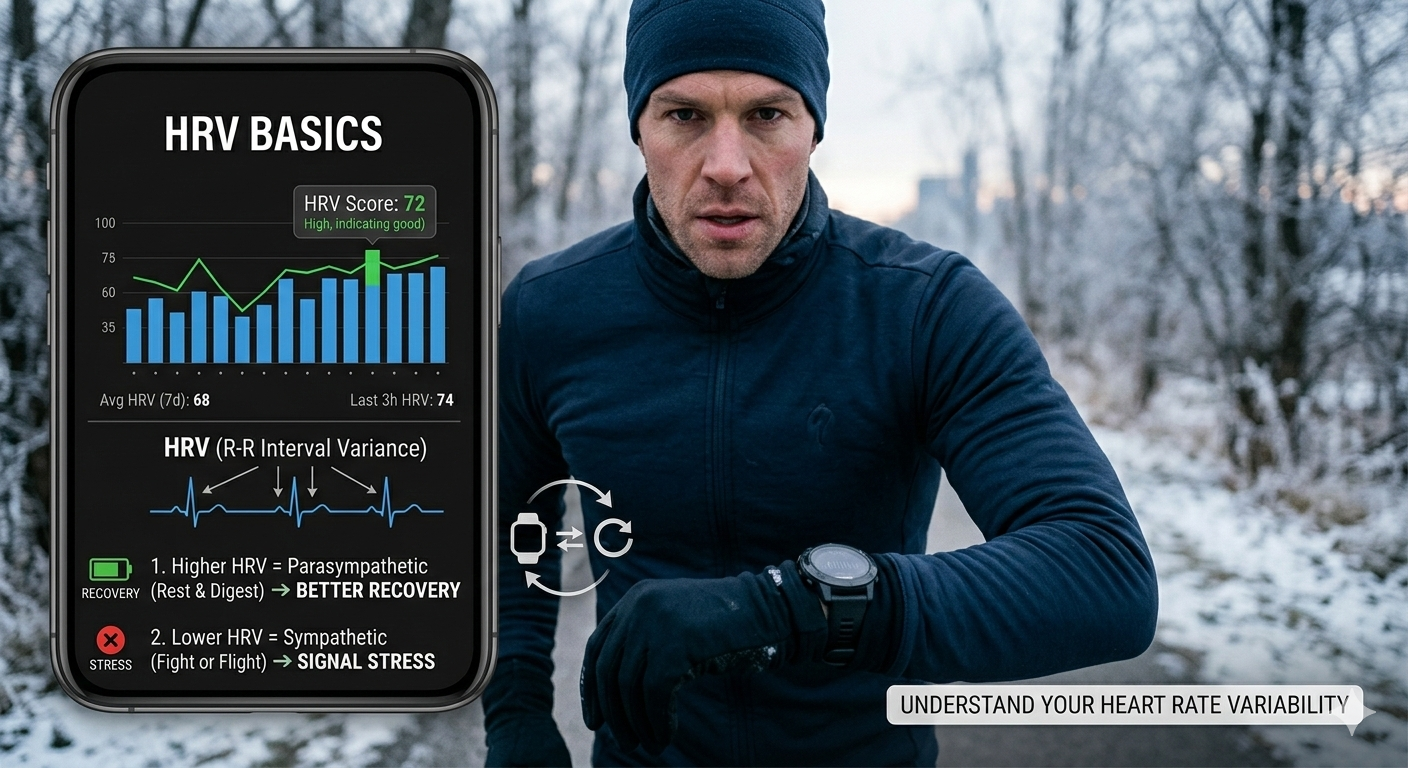
| HRV (Heart Rate Variability) | Autonomic balance (stress vs recovery) | Shows how your body handles cold, stress, and training load |
| Readiness / Recovery Score | Composite of sleep, strain, HR, HRV, etc. | Quick “go/no-go” guide for intensity on dark, low-motivation days |
| Sleep Duration & Consistency | Restoration, hormone balance, immune function | Critical buffer against shorter daylight and higher indoor stress |
| VO₂ Max Estimate | Cardiorespiratory fitness | Tracks whether your winter training is actually preserving/raising fitness |
Think of these as a Winter Readiness Index: not a single number, but a pattern. When 3+ are trending the wrong way, it’s time to adjust.
Step 1: Establish Your Personal Winter Baseline
Your “normal” in June is not your “normal” in February. Cold exposure, less sunlight, and more indoor training shift your physiology.
How to set a 2-week winter baseline
- Pick 14 typical winter days (no travel, no major illness).
- Record:
- Average resting HR (from your wearable’s nightly or morning RHR)
- Average waking HRV (same time window each day)
- Average sleep duration and bedtime/wake time
- Typical readiness / recovery score range
- Note your typical training volume (sessions/week, approximate intensity).
| Metric | Summer You (Example) | Winter Baseline (Example) | Comment |
|---|---|---|---|
| Resting HR | 52 bpm | 54–56 bpm | 1–4 bpm higher in winter is common |
| HRV (nightly avg) | 70 ms | 60–65 ms | Slightly lower due to stress/cold |
| Sleep | 7h 15m | 7h 45m | Longer nights can help offset stress |
| Readiness | 70–85 | 65–80 | Don’t chase summer numbers; chase trends |
The absolute numbers matter less than how far you deviate from your winter baseline and how long that deviation lasts.
Step 2: A Simple Winter Training Decision Tree
Use this decision tree each morning in 60 seconds using your wearable data. Works especially well if you’re following a structured plan like the 8-week winter indoor strength program or a similar schedule.
Morning data check (in order)
- Resting HR vs winter baseline
- +0–3 bpm → neutral
- +4–7 bpm → caution
- +8+ bpm → high alert (illness/overreaching likely)
- HRV vs 7-day rolling average
- Within ±10% → stable
- 10–20% lower → mild suppression
- >20% lower for 2+ days → significant stress load
- Sleep (last night)
- ≥7h and within 30 min of usual time → good
- 6–7h or >60 min bedtime shift → compromised
- <6h or highly fragmented → poor
- Readiness / Recovery score (if your device provides it)
- High zone (top 25% of your normal) → green
- Middle zone → yellow
- Low zone (bottom 25%) → red
Decision matrix: what today’s data means for your workout
| Condition | Data Pattern | Training Call |
|---|---|---|
| Full Push Day | RHR within +0–3 bpm, HRV within ±10% or higher, sleep ≥7h, readiness in middle-high range | Proceed with planned high-intensity or heavy strength. Consider adding 5–10% volume if in a build phase. |
| Controlled Intensity Day | RHR +4–7 bpm or HRV 10–20% down or sleep 6–7h, but readiness not in lowest band |
Keep the session, but: • Reduce volume by ~20–30% • Cap intensity: fewer all-out efforts, shorter intervals • Extend warm-up to 15–20 minutes, especially in cold environments |
| Recovery / Technique Day | RHR +8+ bpm or HRV 20%+ down for 2+ days or readiness in bottom band |
Swap planned hard session for: • 20–40 min easy zone 1–2 movement • Mobility, light strength, or a focused at-home strength & mobility session • Extra 30–60 min sleep if possible |
If in doubt between two choices, pick the more conservative option in winter. Immune stress + training stress + low light is a potent fatigue cocktail.
How to Read Your Charts Like a Data Analyst
1. HR & HRV trend charts
Most platforms give 7–30 day trends. Use these cues:
- Upward drift in RHR + downward HRV trend over 5–10 days:
- Usually indicates cumulative load, illness incubation, or chronic sleep debt.
- Action: Schedule 2–3 “low days” in the next week (reduced volume & intensity).
- HRV rebounding while RHR normalizes:
- Sign you’re adapting to training and/or managing stress better.
- Action: Green light for gradually increasing load.
2. Readiness / strain balance
If your device shows daily strain (training load) vs recovery/readiness, look for:
- High strain + low readiness, 3+ days in a row:
- Overreaching risk is high, especially in winter.
- Action: Insert a 48–72 hour deload (easy activity only).
- Consistently low strain + stable or improving readiness:
- Good time to introduce a progressive plan (e.g., hypertrophy, VO₂ intervals).
3. Sleep regularity vs duration chart
The science is clear: timing consistency often matters more than sheer hours. Use your sleep charts to check:
- Bedtime variability < 30 minutes → autonomic system loves this, HRV often drifts upward.
- Bedtime swings > 90 minutes (common with late-night work or screens) → HRV usually down, RHR up.
If your schedule is naturally late or variable (e.g., remote work, late meetings), layer in the protocols from the evening-shift & remote worker sleep guide to stabilize circadian input.
VO₂ Max Estimates: Are You Actually Keeping Fitness in Winter?
Consumer VO₂ max estimates (Garmin, Apple, Polar, etc.) aren’t laboratory-precise, but their trends are useful if:
- You regularly record outdoor or well-calibrated indoor activities.
- You train at a range of intensities (not only easy strolls).
Interpretation framework
- Flat or gently rising VO₂ max (±1–2 points) while strength increases:
- You’re maintaining or slowly improving cardiorespiratory fitness – ideal winter outcome.
- VO₂ max dropping >3 points over 6–8 weeks:
- Likely shift to too much low-stimulus, low-intensity time without enough actual cardiovascular stress.
- Action: Add 1–2 weekly sessions with 4–8 min intervals in zone 3–4, or tempo blocks in indoor workouts.
Combine this with lifting-focused plans (like the winter hypertrophy or at-home strength programs) to emerge from winter both stronger and aerobically intact.
Winter-Specific Tweaks Backed by Your Data
1. Use HRV & RHR to time cold exposure and contrast therapy
Cold and hot-cold contrast are powerful stressors. Pair them strategically with your data:
- If HRV is stable or elevated and RHR normal → you can tolerate contrast sessions (e.g., alternating hot and cold as outlined in a cold–heat contrast protocol).
- If HRV is suppressed 20%+ and RHR elevated → treat cold exposure like hard training: reduce frequency/intensity or skip that day.
2. Match caffeine to your readiness patterns
- Low readiness + high caffeine repeatedly → your charts will often show poorer sleep and depressed HRV 24–48 hours later.
- Guideline: On “red” days, delay caffeine 60–90 minutes after waking, cap total intake, and lean on light exposure and movement instead.
3. Let your data set your minimum winter sleep target
Scan your charts for weeks where HRV is highest and RHR lowest. Note the average sleep duration in those weeks. That becomes your personal winter minimum, which is often 20–40 minutes higher than in summer.
Putting It All Together: Your Winter Data Playbook
To operationalize this without overthinking:
- Track: Wear your device nightly, log basic training and illness notes.
- Review weekly:
- 7-day trends for RHR, HRV, sleep, and readiness
- VO₂ max estimate trend every 2–4 weeks
- Decide daily using:
- Morning check → Push / Controlled / Recovery day
- Adjust volume and intensity, not just “yes/no workout.”
- Adjust monthly:
- If HRV is rising and VO₂ stable → you can gradually increase training load.
- If HRV is falling and VO₂ dropping → cut load by 20–30% for 7–10 days, then rebuild.
Your winter performance isn’t about chasing perfect numbers; it’s about making slightly better decisions most days. When your wearable stops being noise and becomes a guidance system, February turns from survival mode into a stealth training advantage.